Identification of the Most Frequently Asked Questions in Financial Analyst Reports to Automate Equity Research Using Llama 3 and GPT-4
The Structure of Financial Equity Research
Financial equity research reports (ERRs) are a means to communicate buy and sell recommendations about individual stocks. Banks and independent research firms write those reports to convince their clients to buy or sell stocks (earning the banks a brokerage commission), or to receive direct compensation for their research. Typically, financial experts, so-called “analysts,” cover a basket of stock-listed companies from one or two industries over a long period of time, and update their ERRs whenever important news come out (often after quarterly reports) [36].
ERRs typically contain a stock price target (e.g., a forecasted stock price of $250 per share within the next 12 months) as well as a buy, hold, or sell recommendation.
The banks’ clients and the general market use these reports to support investment decisions in the stocks (and, to a lesser extent, bonds) of these companies.
Financial Text – One Hard Nut to Crack for Automation
Relevance
In the financial literature, ERRs are established as important sources of information [44, 45, 46, 47, 48]. They offer some empirically validated insights into the future stock performance of firms [49], so they may indeed help investors to make decisions.
Issues With Financial Equity Research: Bias and Cost
But a problem remains: Many reports are written by banks, and banks have an inherent interest in earning commissions from trades placed by their clients. This means they often want to convince (potential) clients to buy stocks, possibly introducing a reluctance to publish negative coverage [42, 43]. [36] found that only 0.5% of all reports contained sell recommendations before the dot-com bubble burst. Prior research showed less extreme results, with 14% sell recommendations between 1989 and 1991 [49], but the direction is still clear: ERRs seem to be a tad to positive and not entirely unbiased.
Another issue with ERRs are cost. As our results below show, much of equity research is just a presentation of financials. Overall, ERRs follow a mechanistic, descriptive pattern. It is thus questionable if significant human input is warranted and useful. Given the concerns around biasedness in equity research, the field may thus benefit from further automation. Our paper provides the groundwork for systematic automation of equity research.
The Structure of Equity Research
While research about the relevance and biasedness of equity reports is plentiful, there is little understanding about what types of contents these reports cover and to what extent the context might be automated. So far, there was no systematic research into the structure of financial equity research reports – so that is where our research comes in. Based on 72 English equity research reports written between 2018 and 2022, covering a broad range of authors (banks) and covered companies, we empirically uncover how equity analysts write.
Let’s start with the basics: Equity research reports are consistently short. Unlike annual reports, which usually have hundreds of pages, equity research is short and concise, and reports with 20 pages are long outliers already.
The figures below illustrate that most reports have between 4 and 9 pages, and they do not contain more than 120 statements.
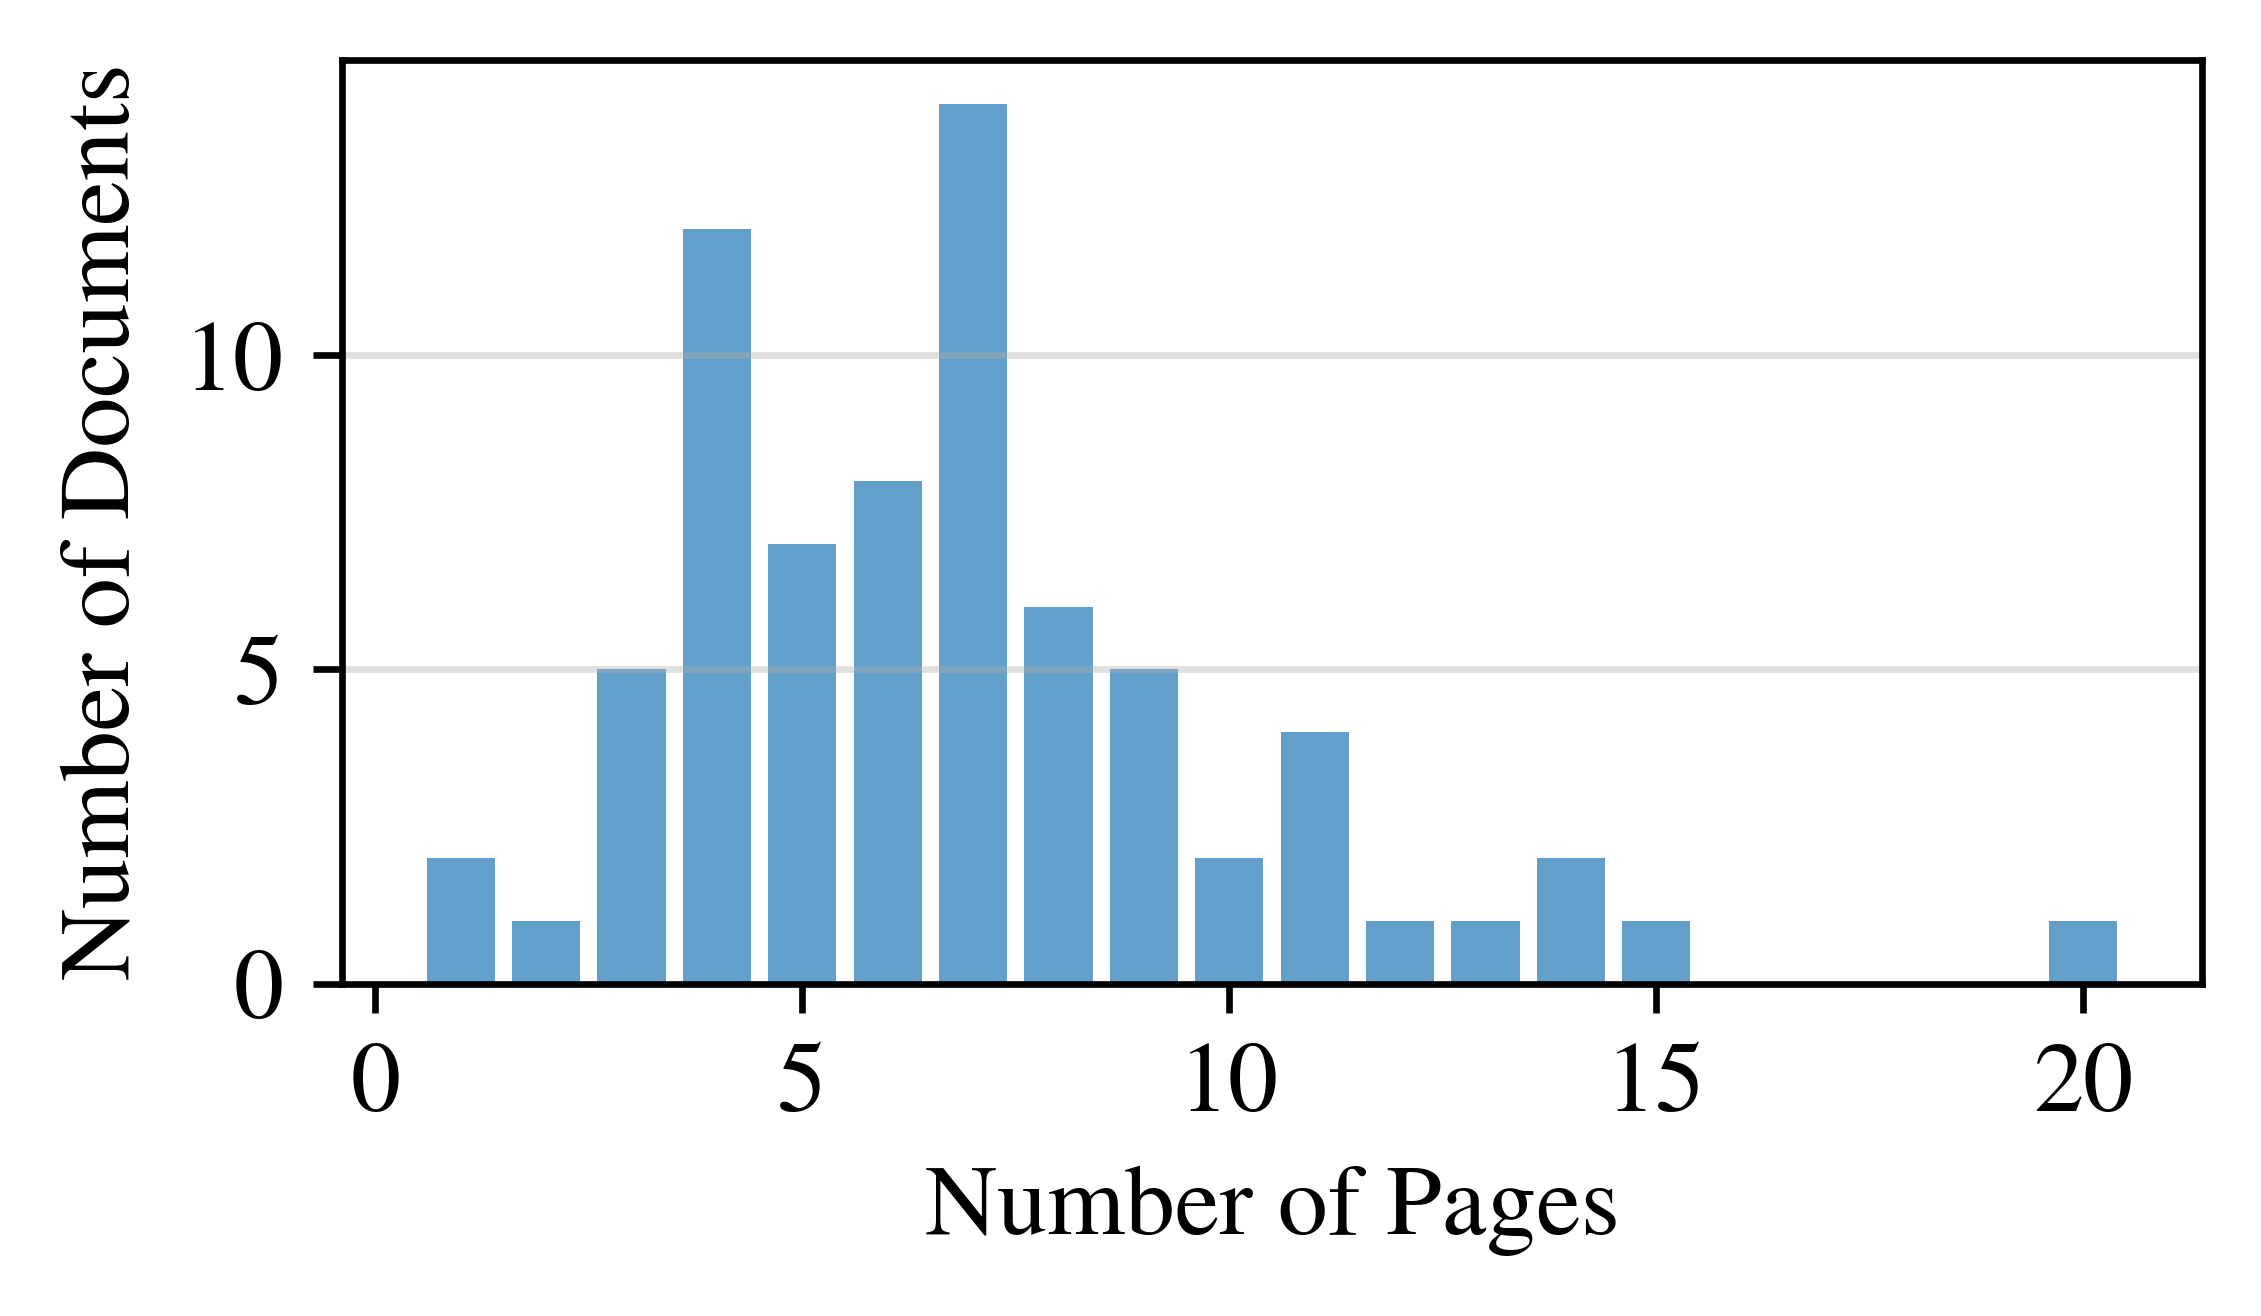
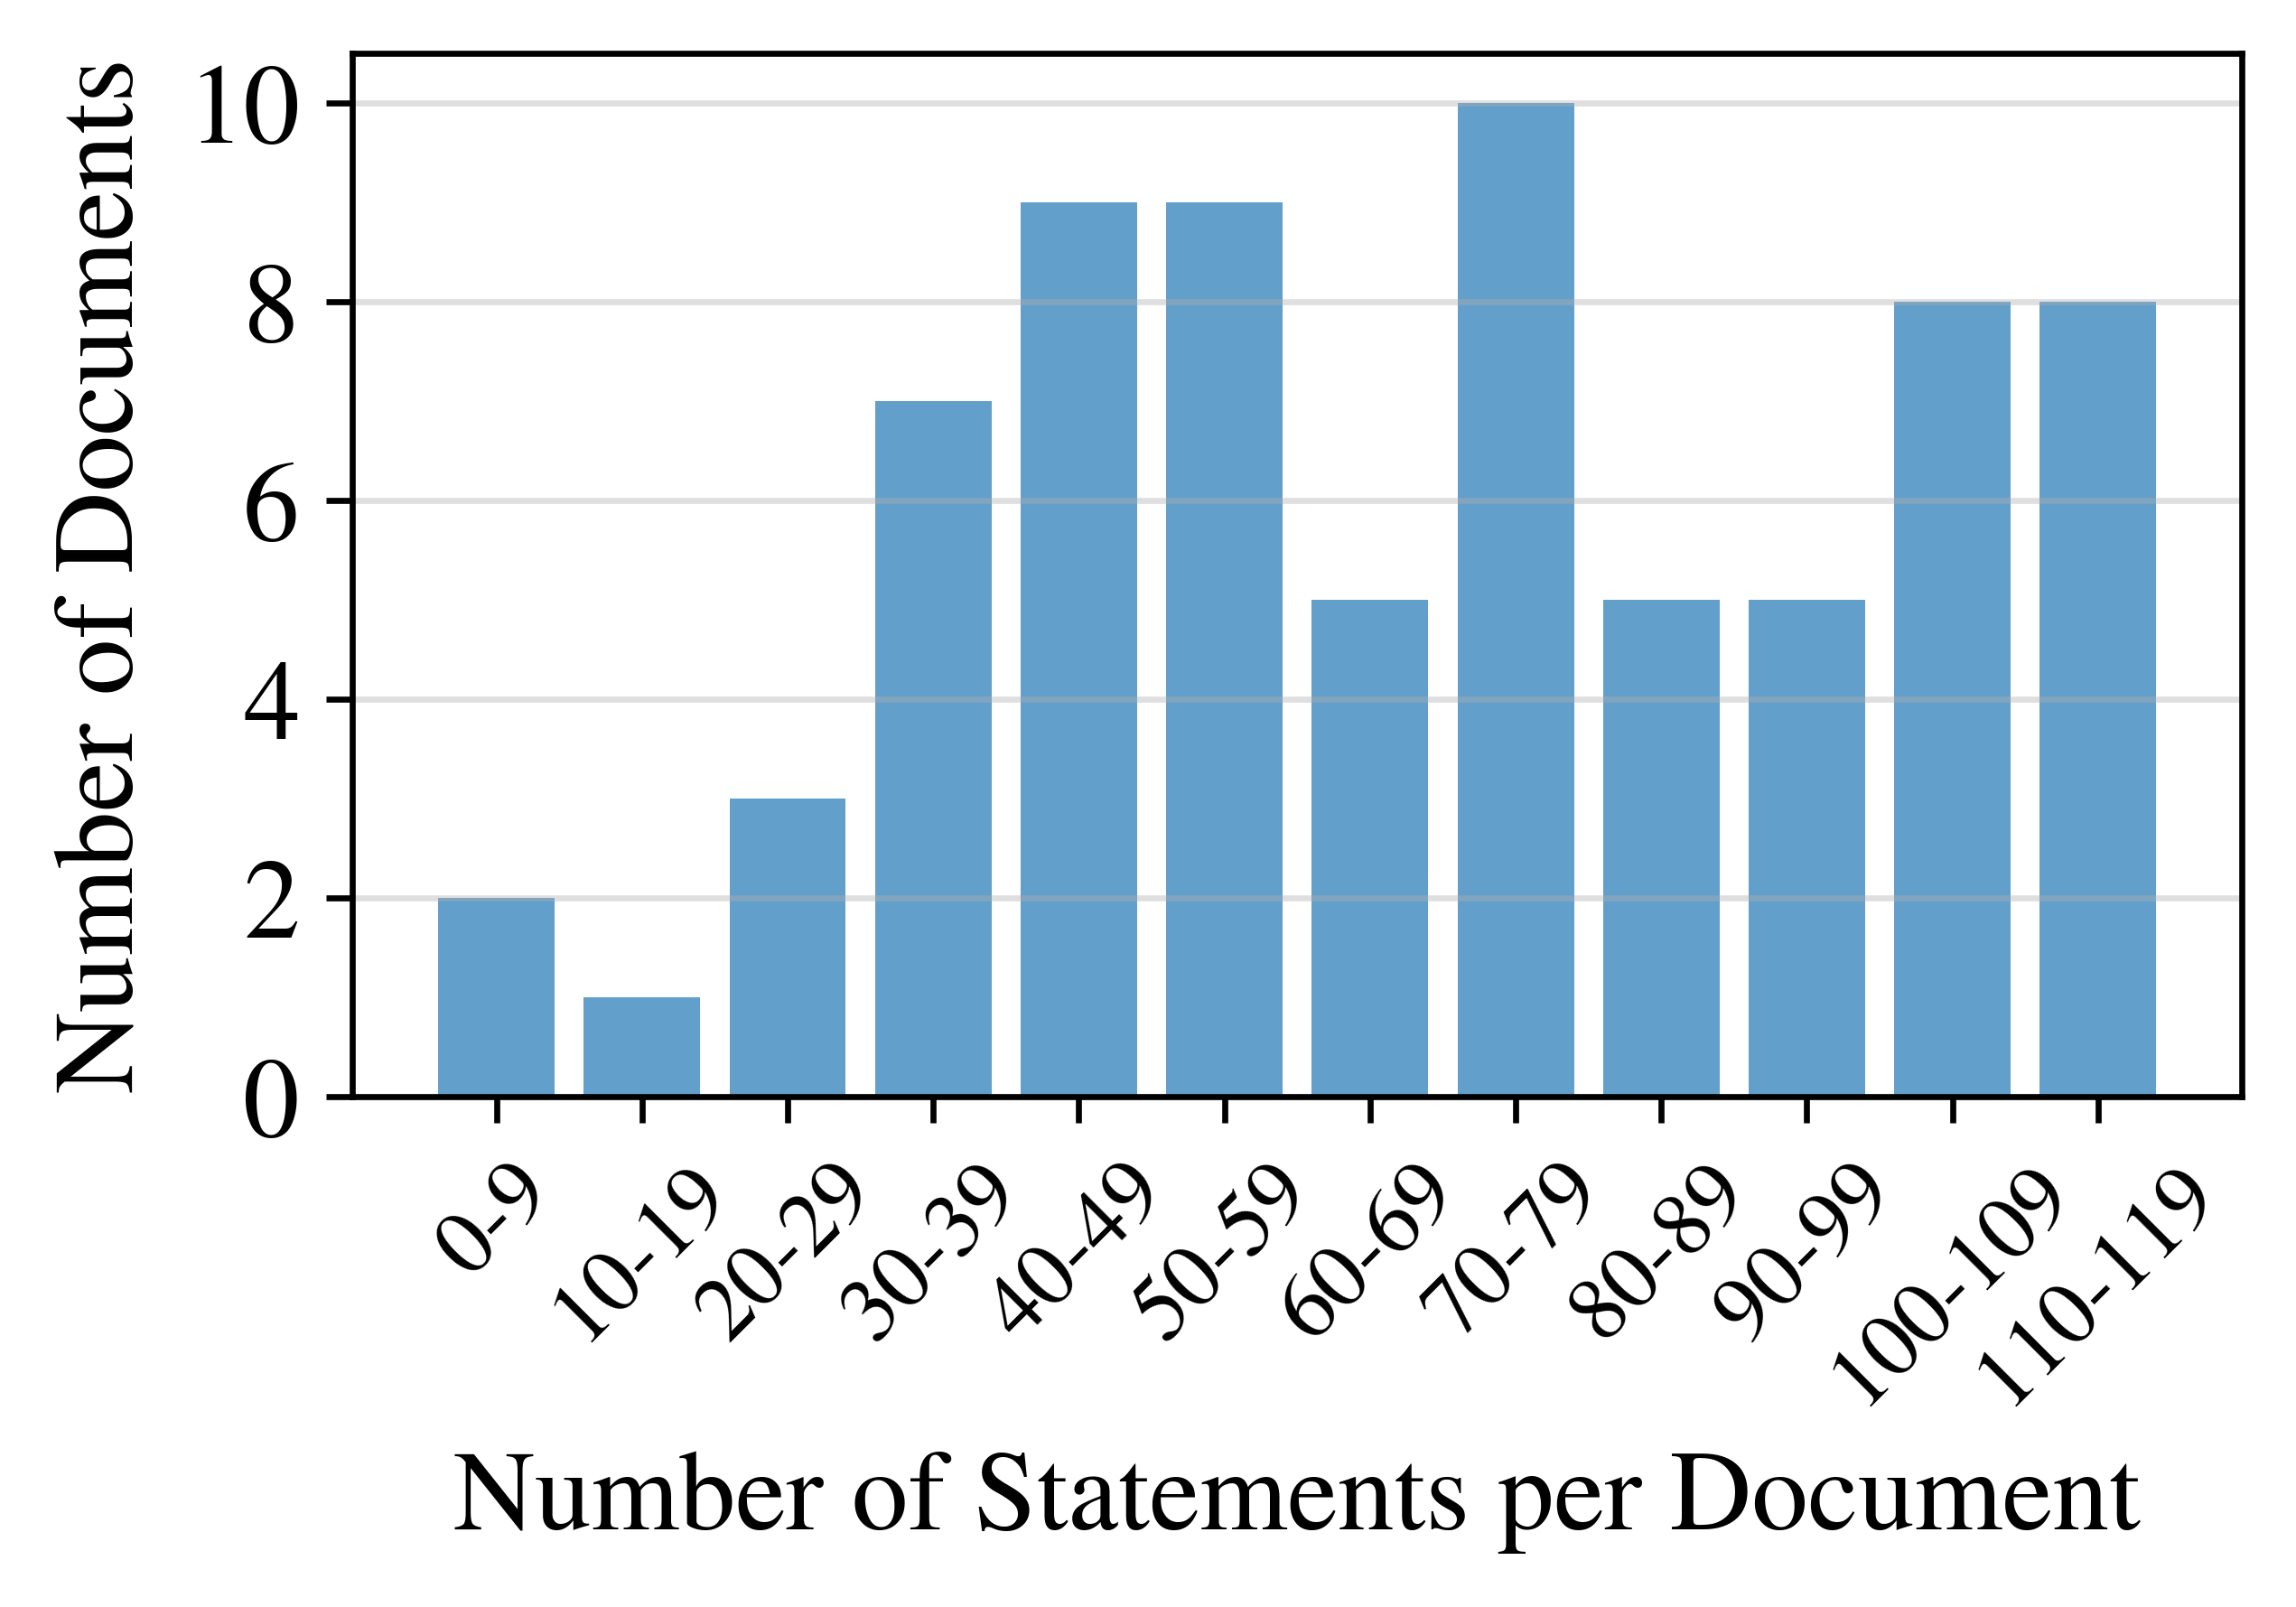
Distribution of page counts and statement counts of equity research reports. Most reports have between 4--9 pages and 30--120 statements. Including appendices.
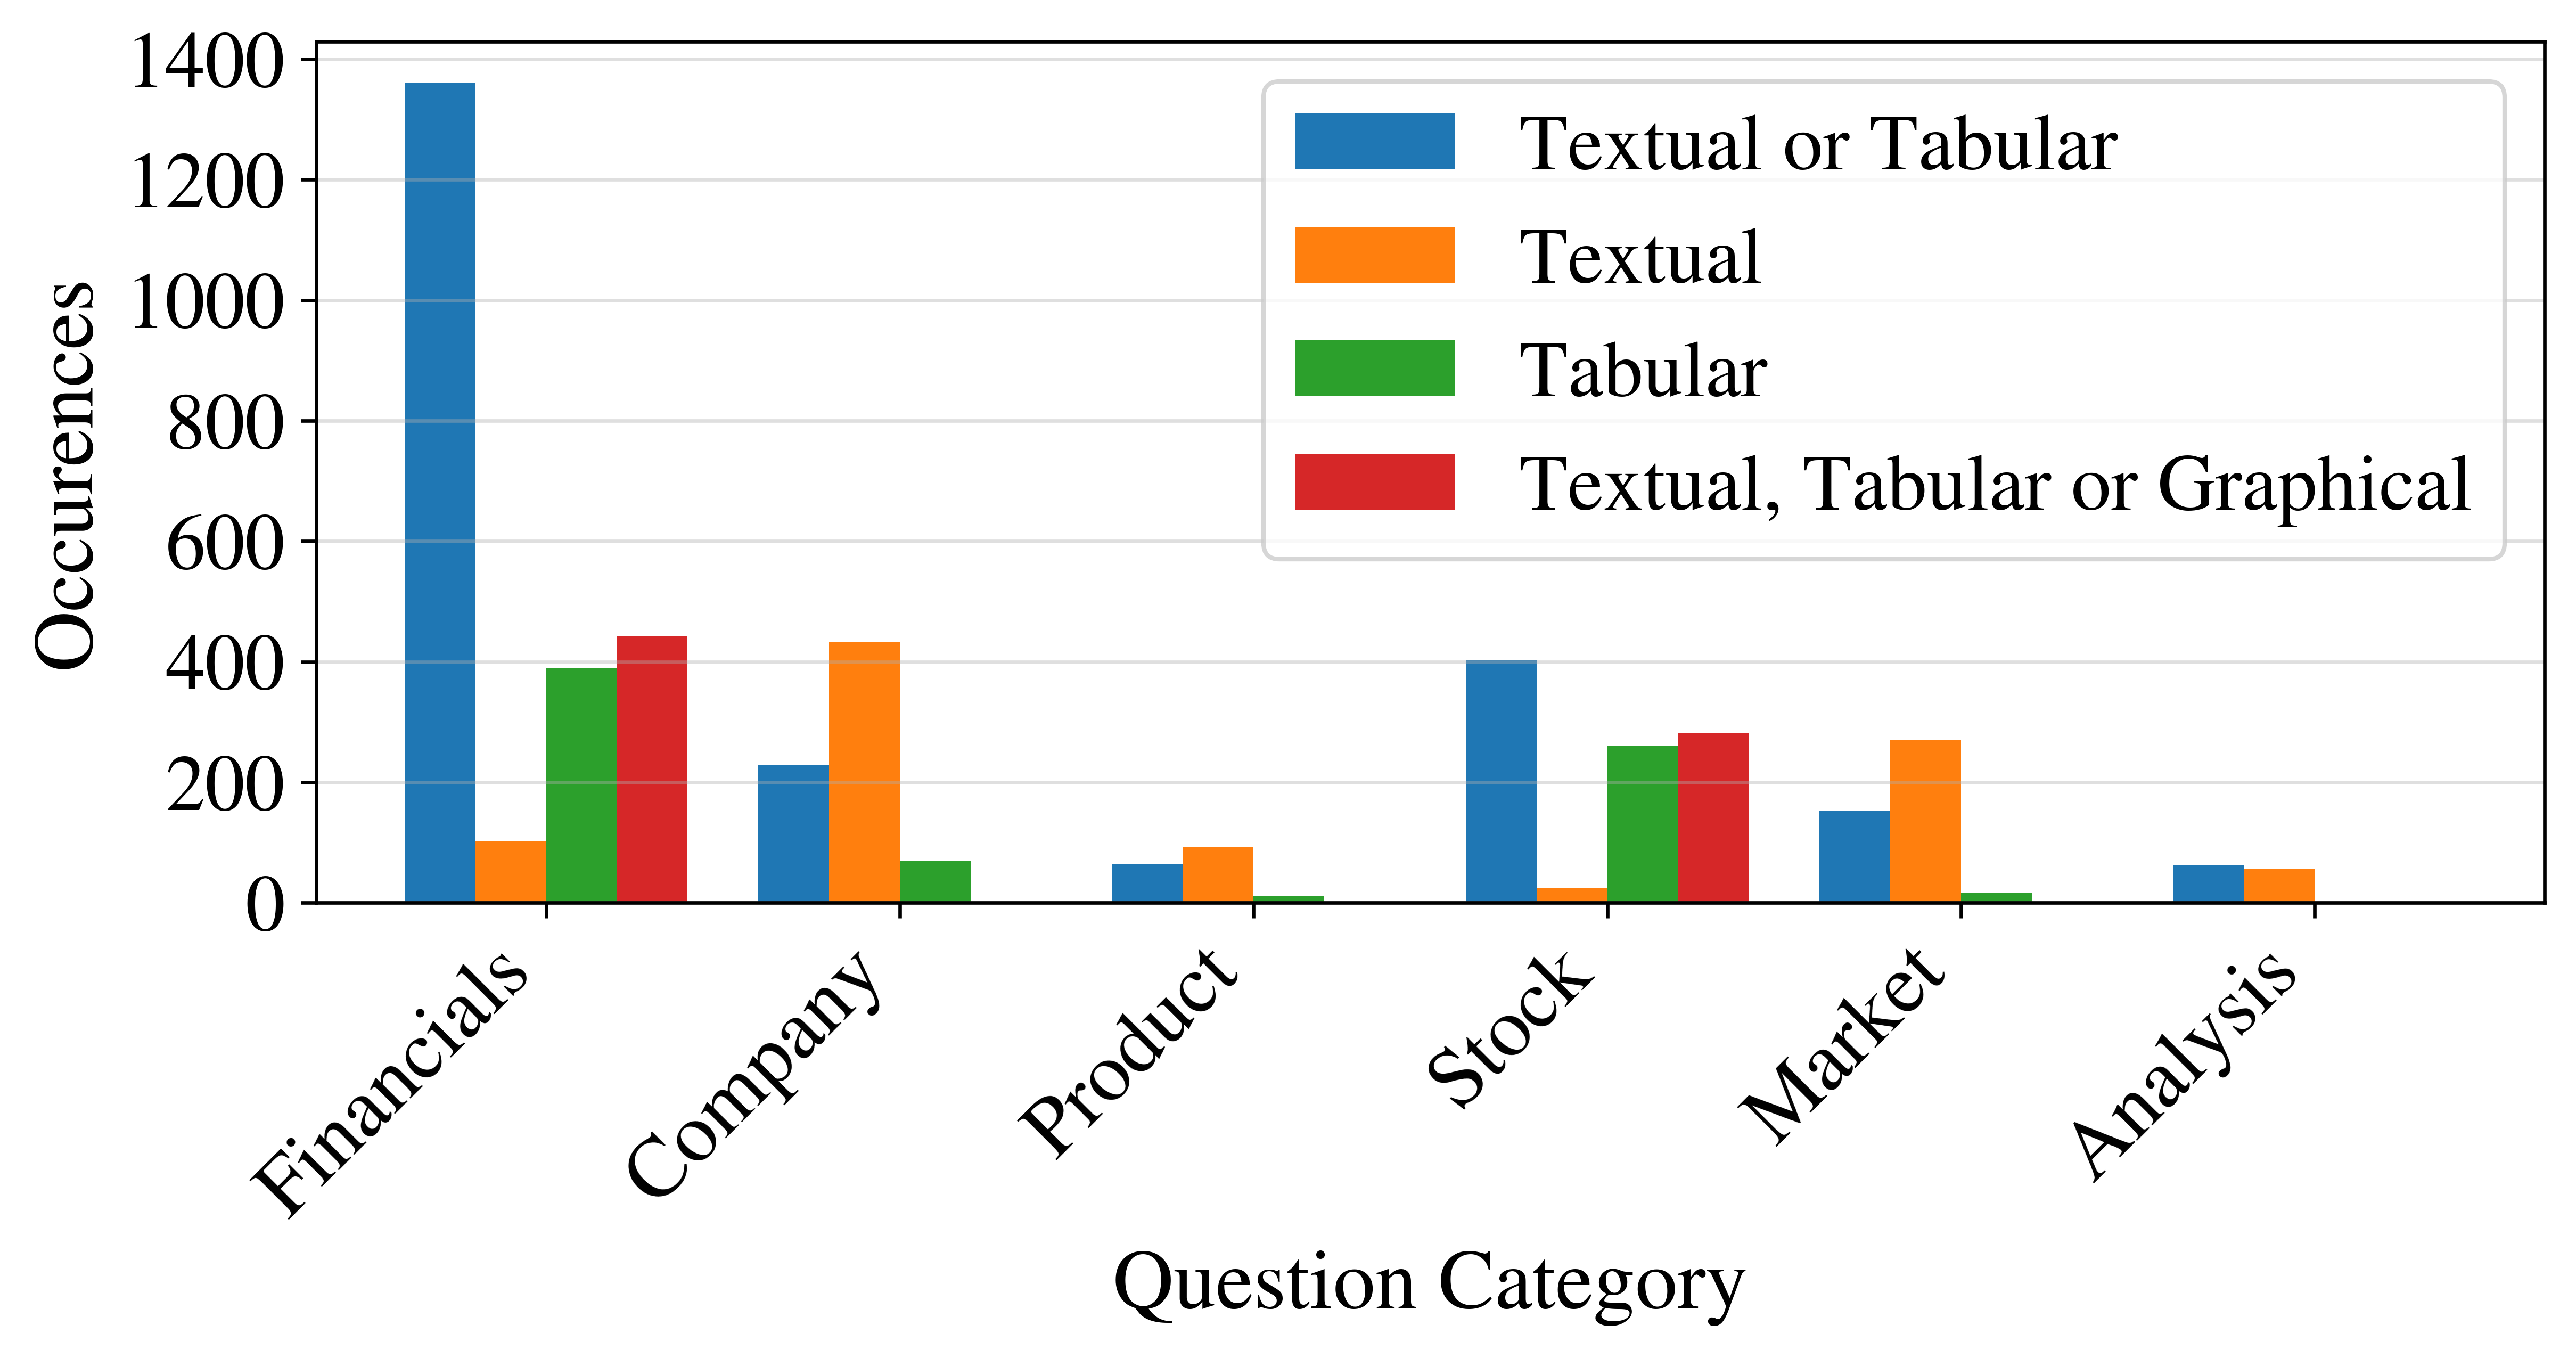
Different types of information are systematically presented with different modes of display. Financial information is often structured enough to be displayed in tables and diagrams, while company and market overviews are usually verbal.
How Do Banks and Independent Analysts Present Their Analyses?
In our study Pop & Spörer (2025), we found that text and tables are the dominant ways of conveying information in equity research reports. Diagrams, which often come in the form of stock price charts, are less relevant overall. Custom diagrams that show complex business relationships, product specifications, or market dynamics, are an absolute exception.
Textual and tabular statement can often be expressed in various ways, and analysts switch between textual and tabular modes. Different banks tend to have different styles. Some make heavy use of tables, while others present almost all information in text form. This heavy reliance on text and tables is a potential for LLMs, as text and tables are the native domain of language models. Today’s language models can write tables in Markdown or in other machine-readable formats.
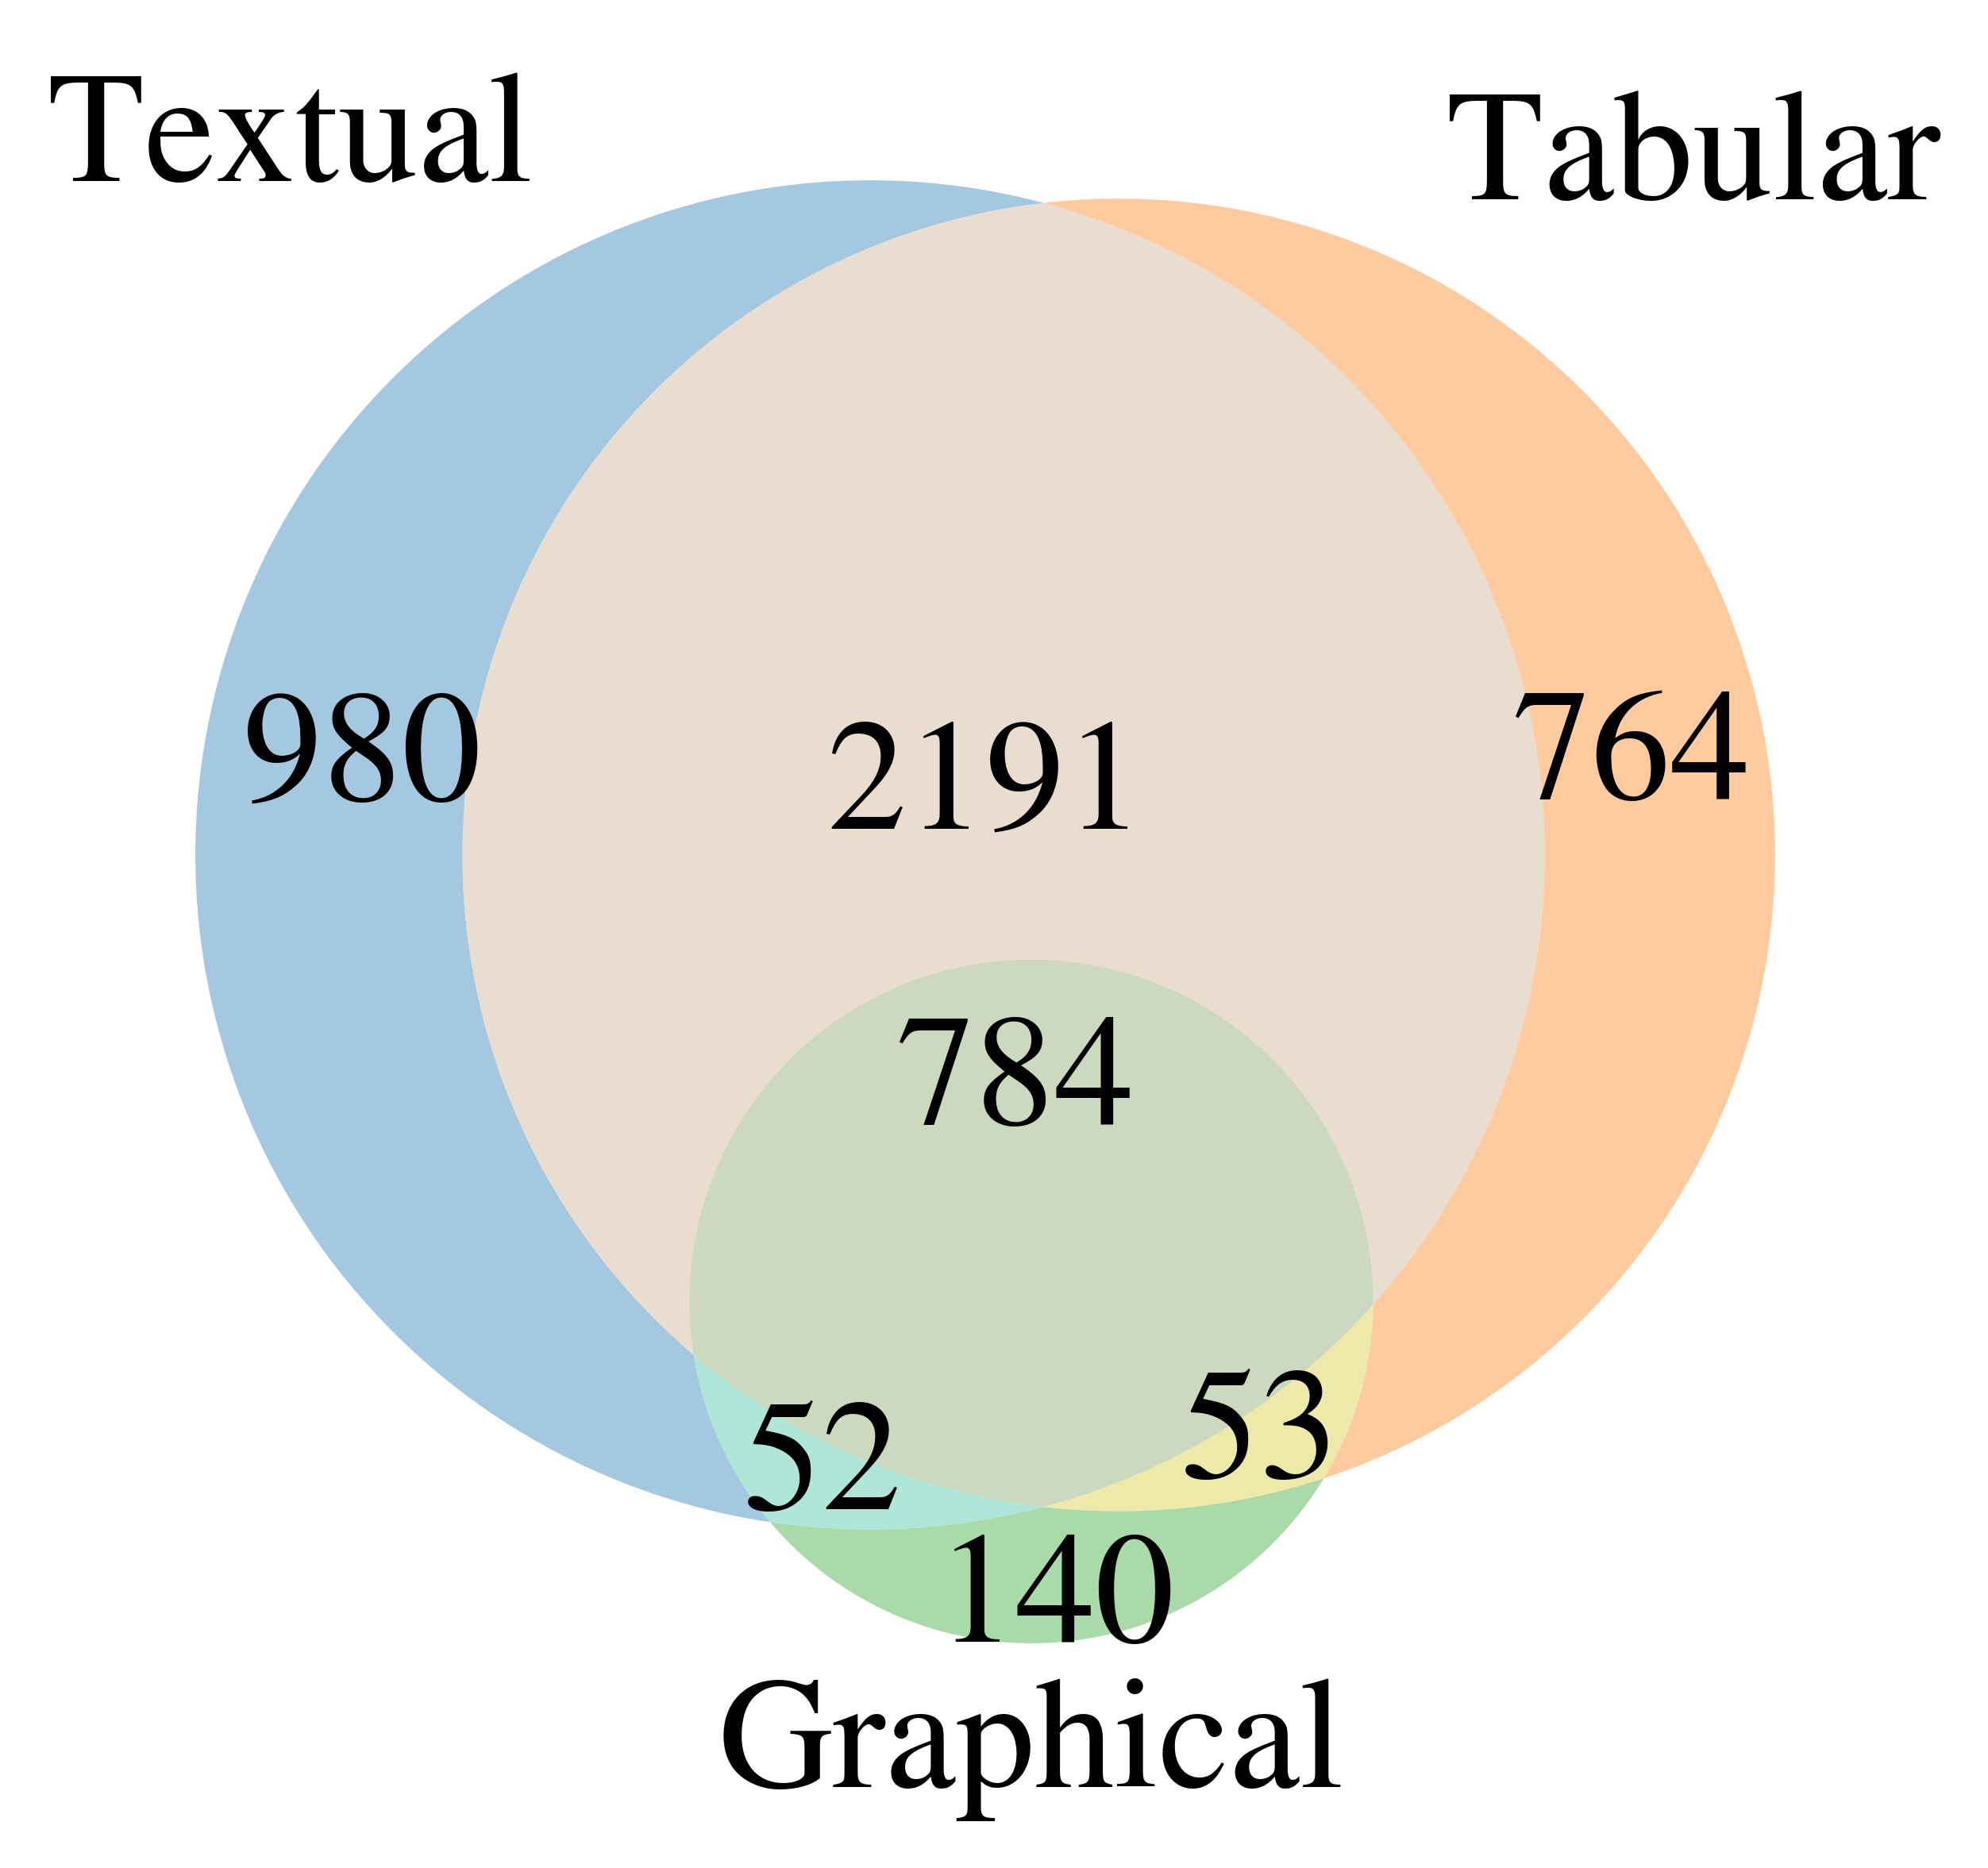
There is significant overlap between presentation modes for the same statements. Textual and tabular representation modes are dominant.
Analysts have a strong bias in favor of the type of information that they know best: Financials. This is reflected in the following diagram, which shows that most statements fall into the “Financials” category. As mentioned above, analysts usually do not take the time to present product-specific diagrams or to display market dynamics or supply chains in graphical form. The category “Product” illustrates.
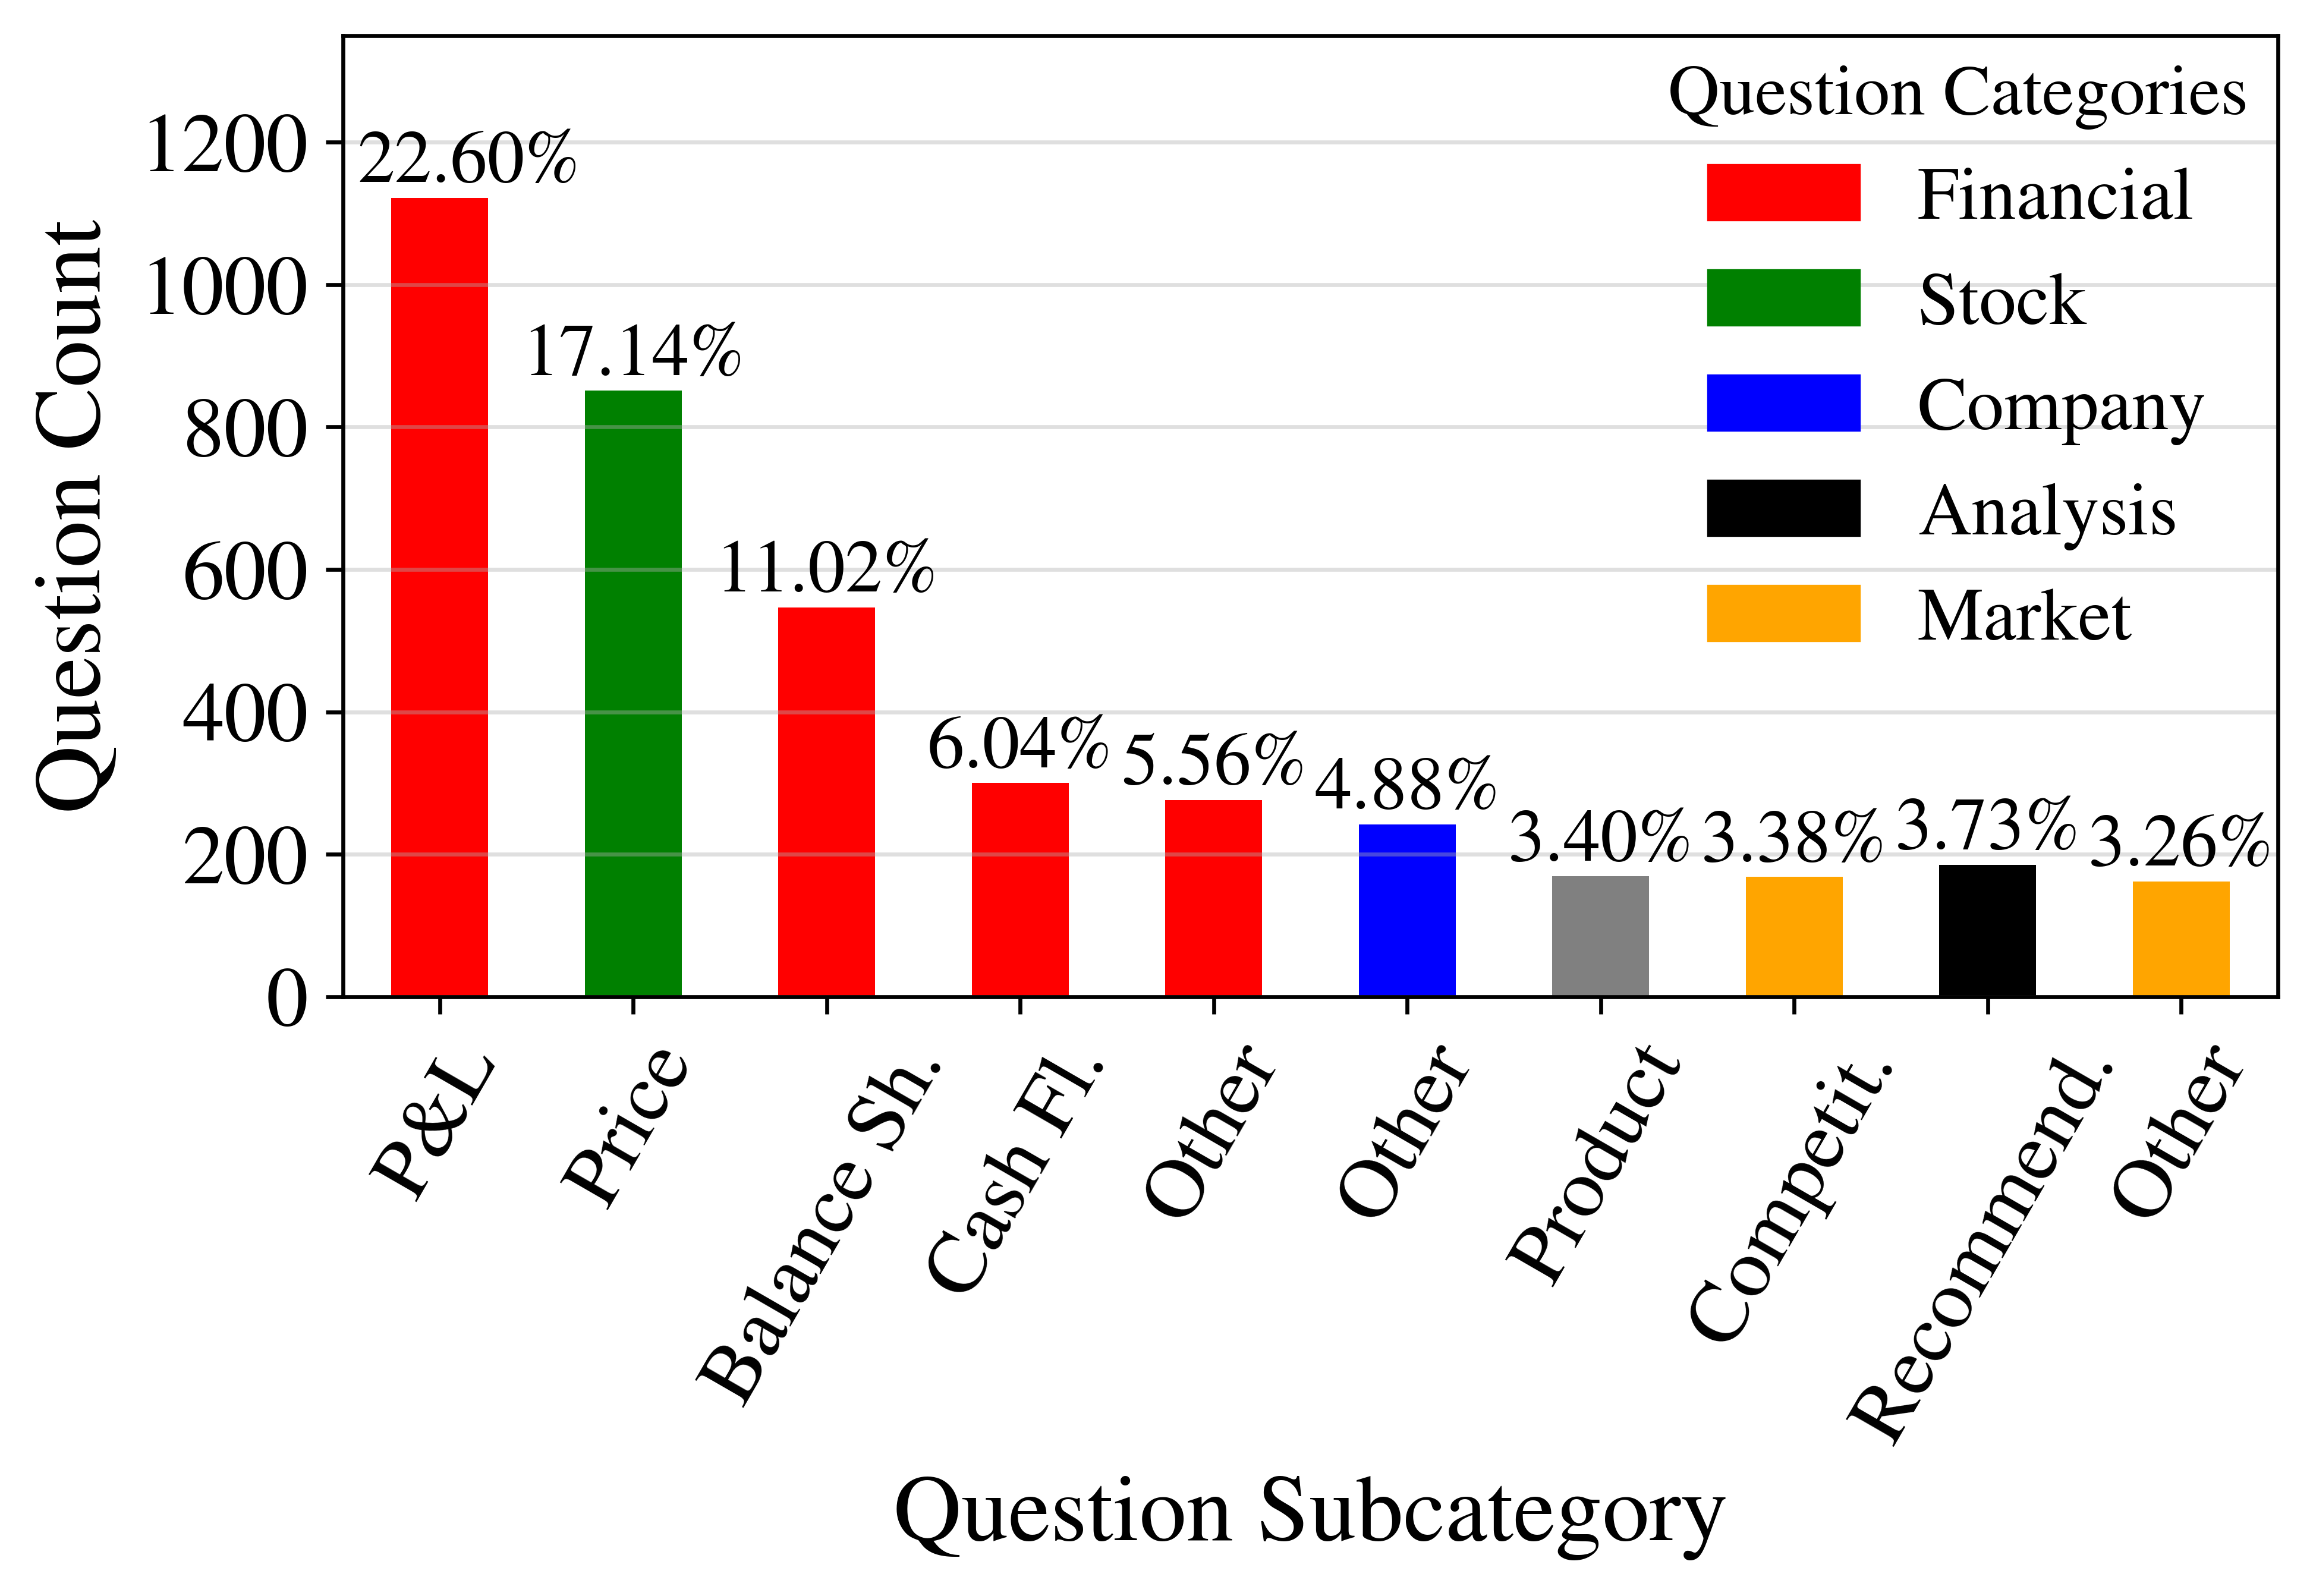
Statements about the income statement (profit & loss -- P&L) are the most frequent question subcategory in our typology. Most of the other top subcategories also fall in the Financials subcategory. An exception is the Stock Price subcategory, which is the second most important subcategory by frequency.
How Large is the Dent That LLMs Can Make in Automating Equity Research?
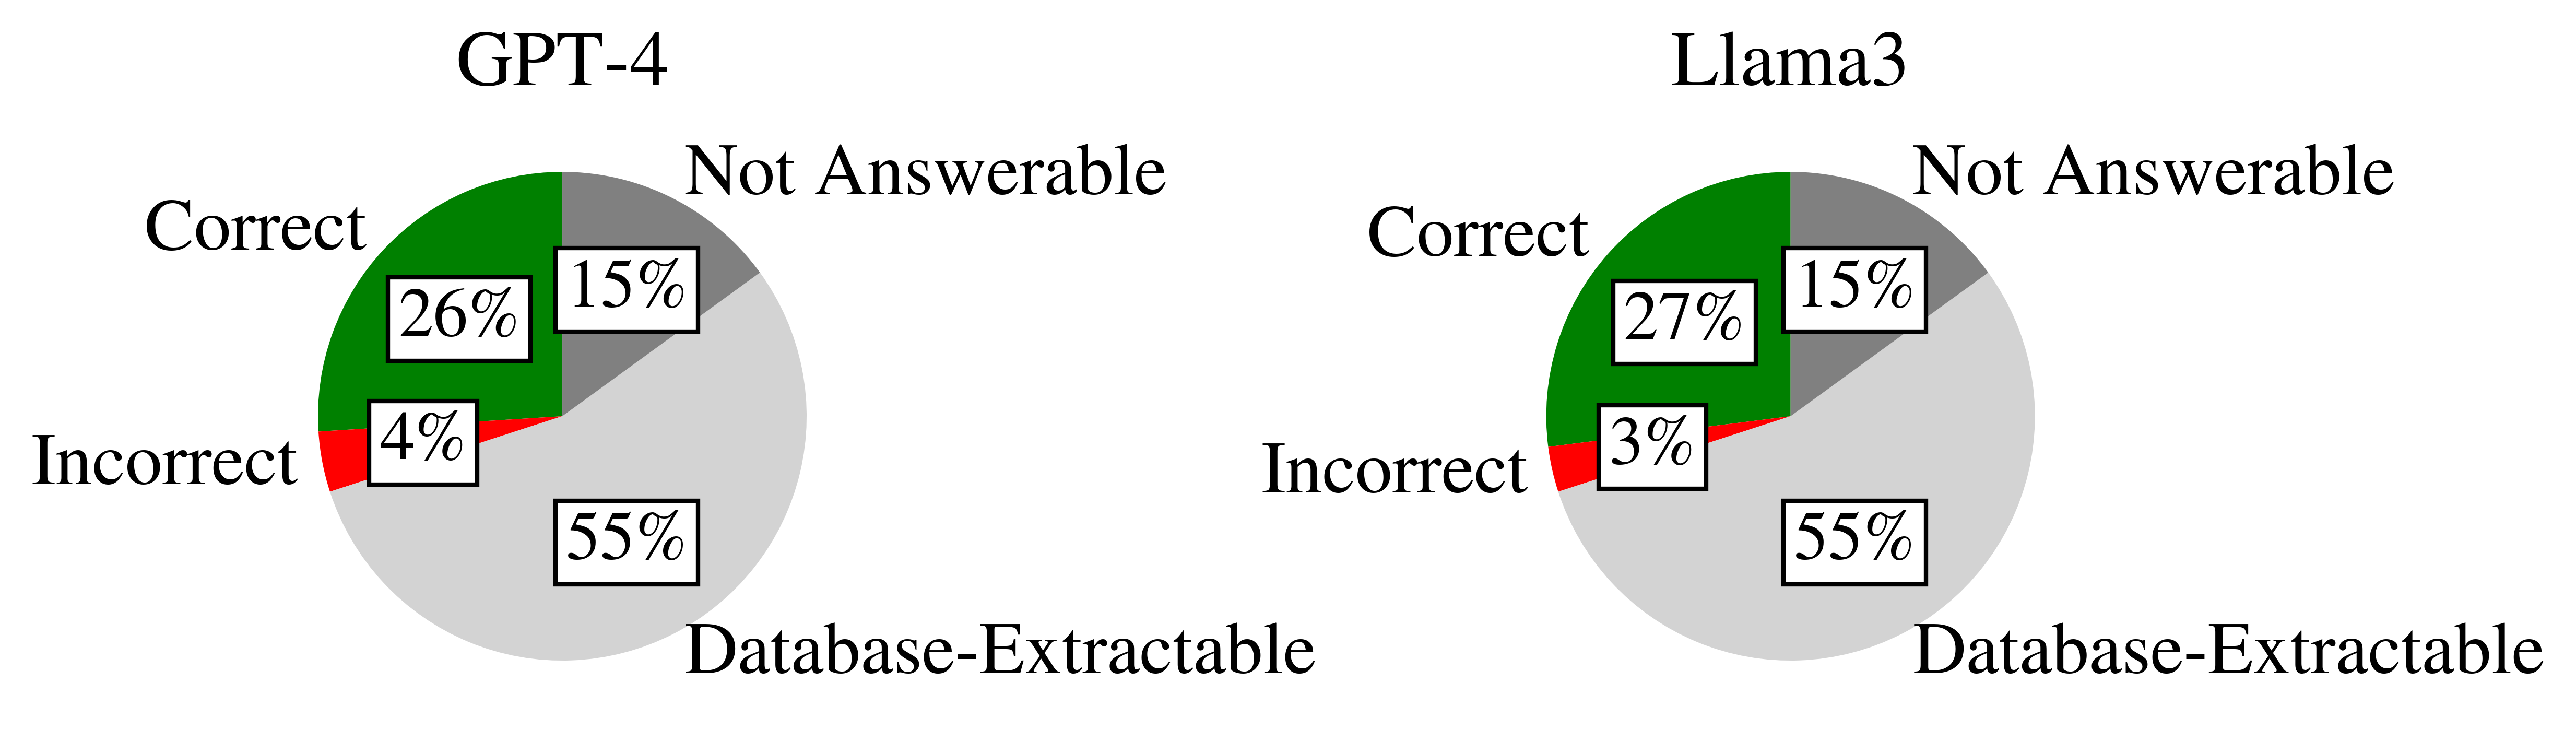
According to our research, already 55% of the statements from equity research reports are automatable, even without any use of AI/LLMs. This is due to the comprehensive data coverage that financial databases such as Bloomberg provide. Executive changes, financials, and subsidiary structures are readily available in structured format in these databases.
Thus, to evaluate the automation potential that LLMs can still have, we substracted this 55% from the overall pie, and ended up with 30% of automation potential for LLMs. Thus, only 15% of statements in ERRs cannot be automated.
Of these 30%, 26 percentage points were answered correctly by GPT-4, and 27 percentage points were answered correctly by Llama-3. The error rate is reduced when a perfect ensemble of these two models is assumed, as we show below.
Language models can close a gap that financial databases leave open. Still, we think that human input is still required, as we assume non-fact based statements (opinions) and strategic outlooks cannot be automated by LLMs.
Potential for Model Ensembles
We found that GPT-4 and Llama-3 complement each other. In our small-scale analysis, when one of the models fails to answer a question correctly, the other model almost always is able to “help out.”
This result shows that there is potential in multi-AI (or multi-agent) systems that outperform single-model inference.
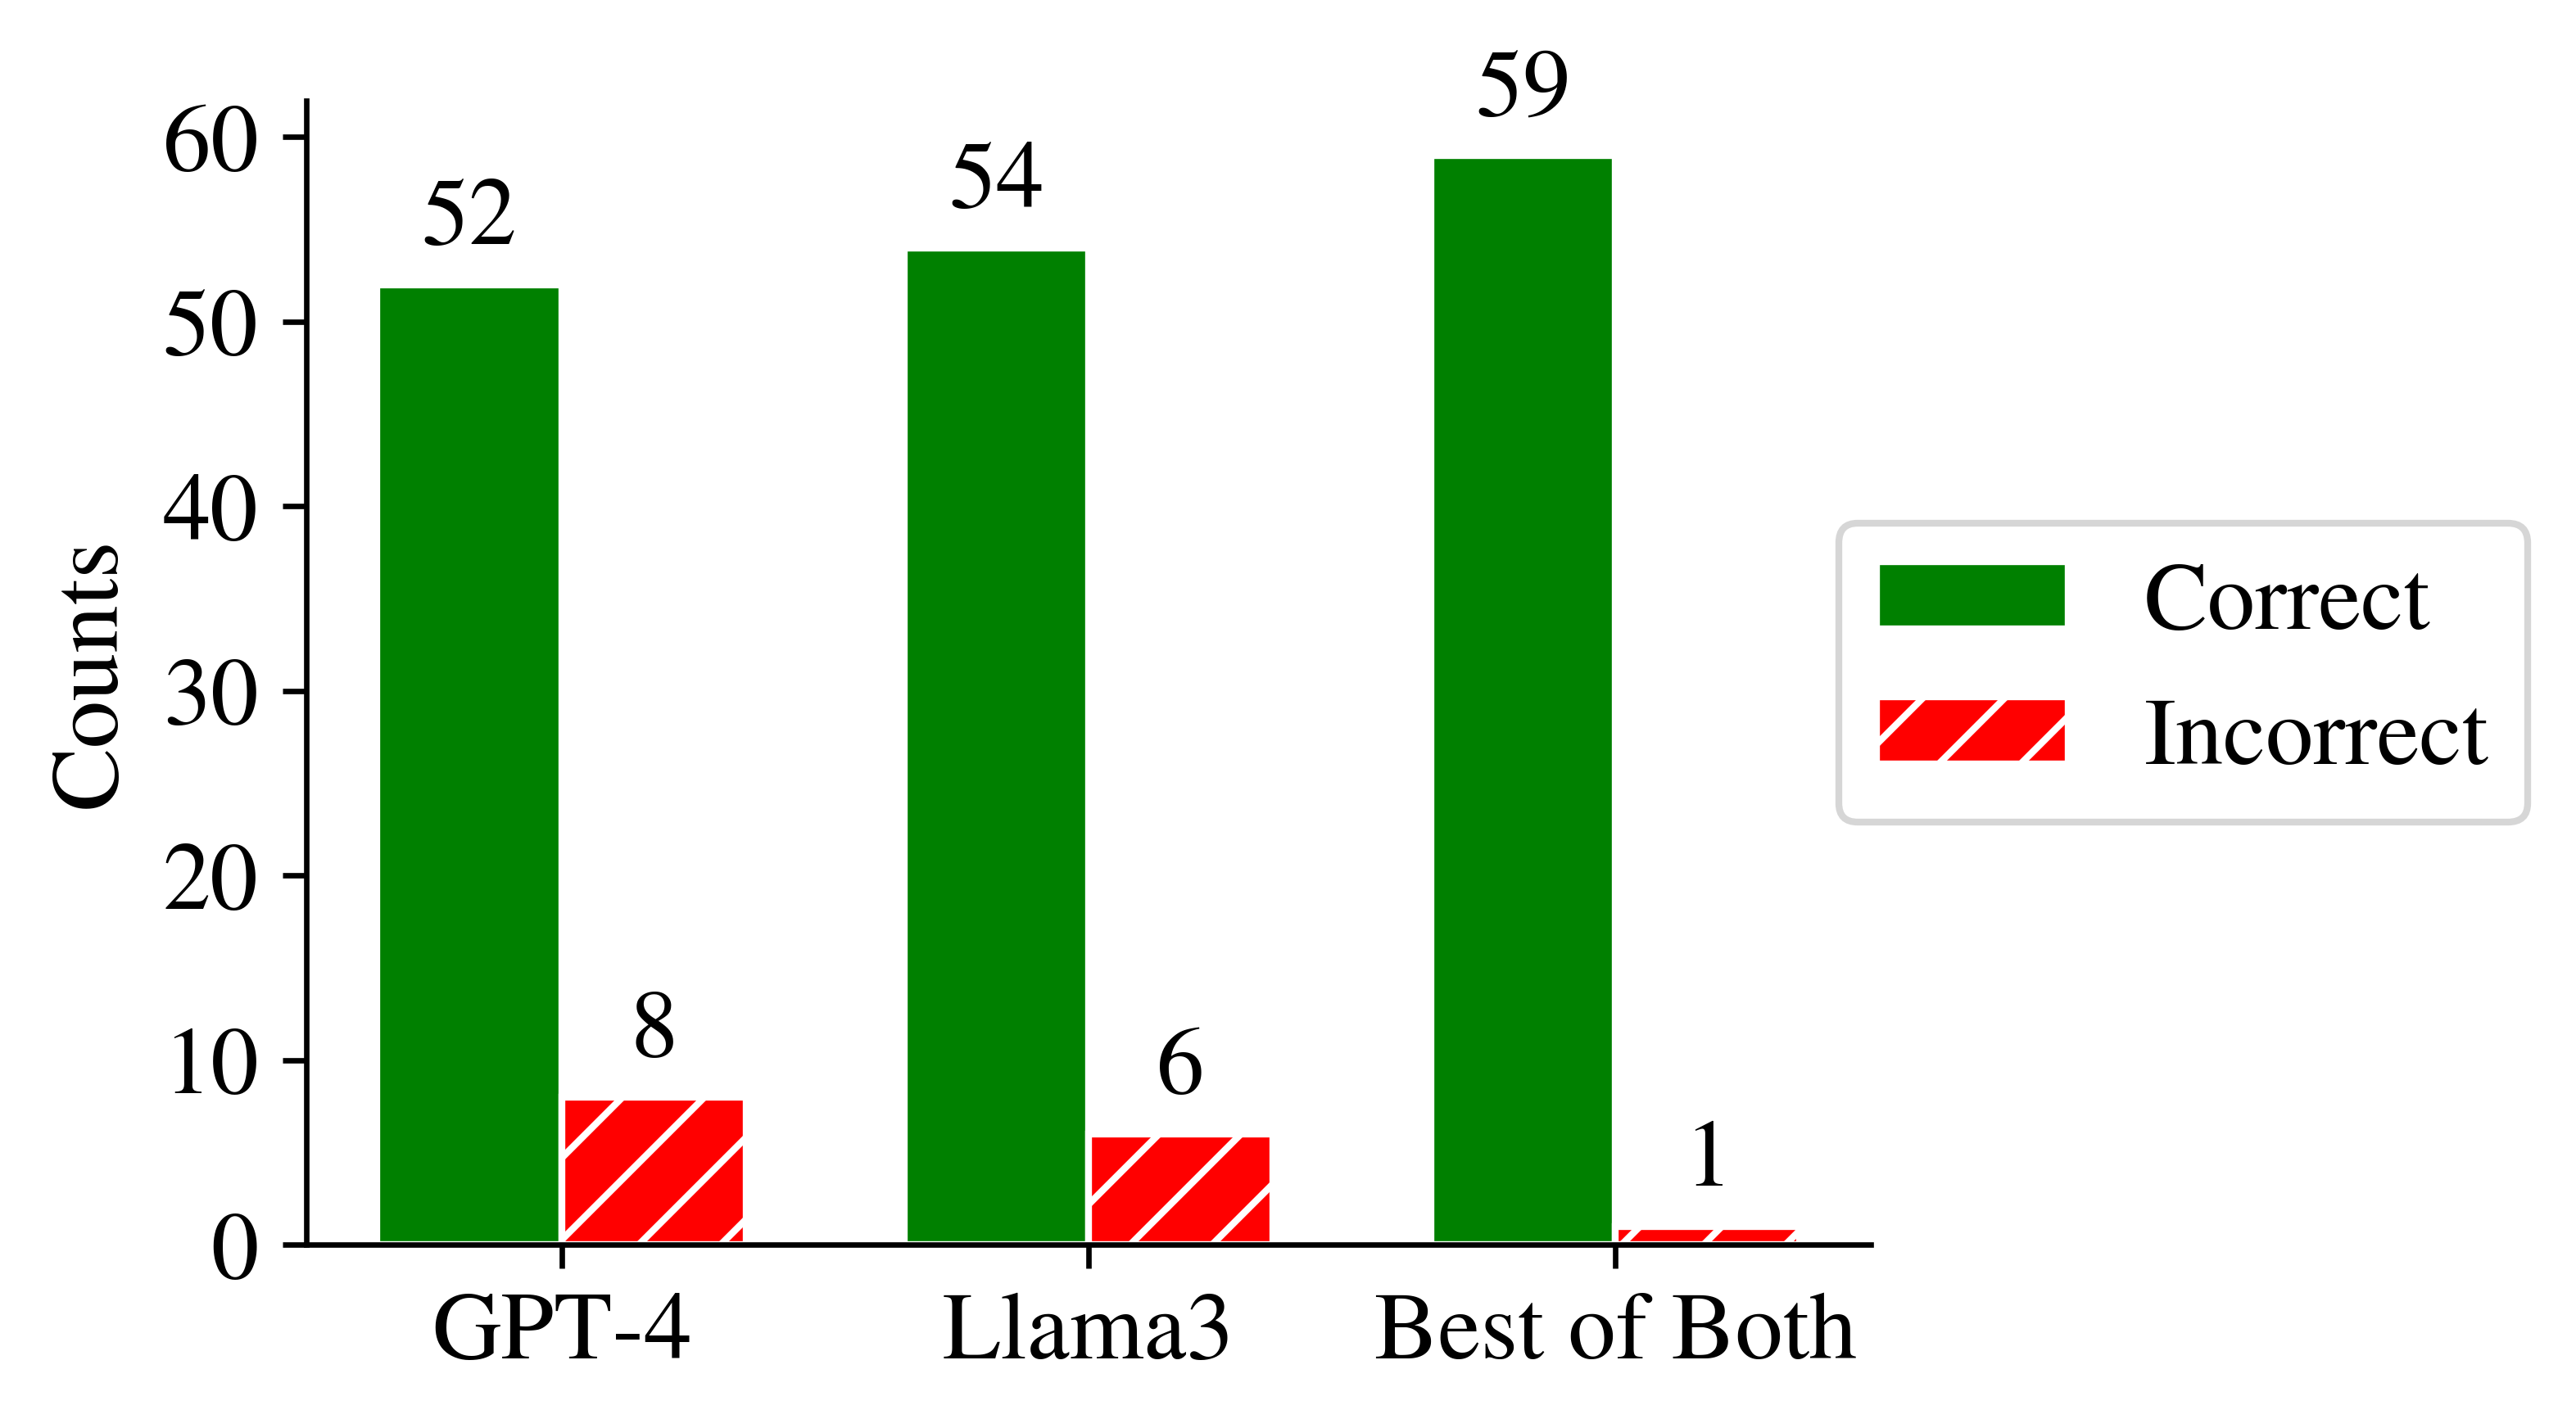
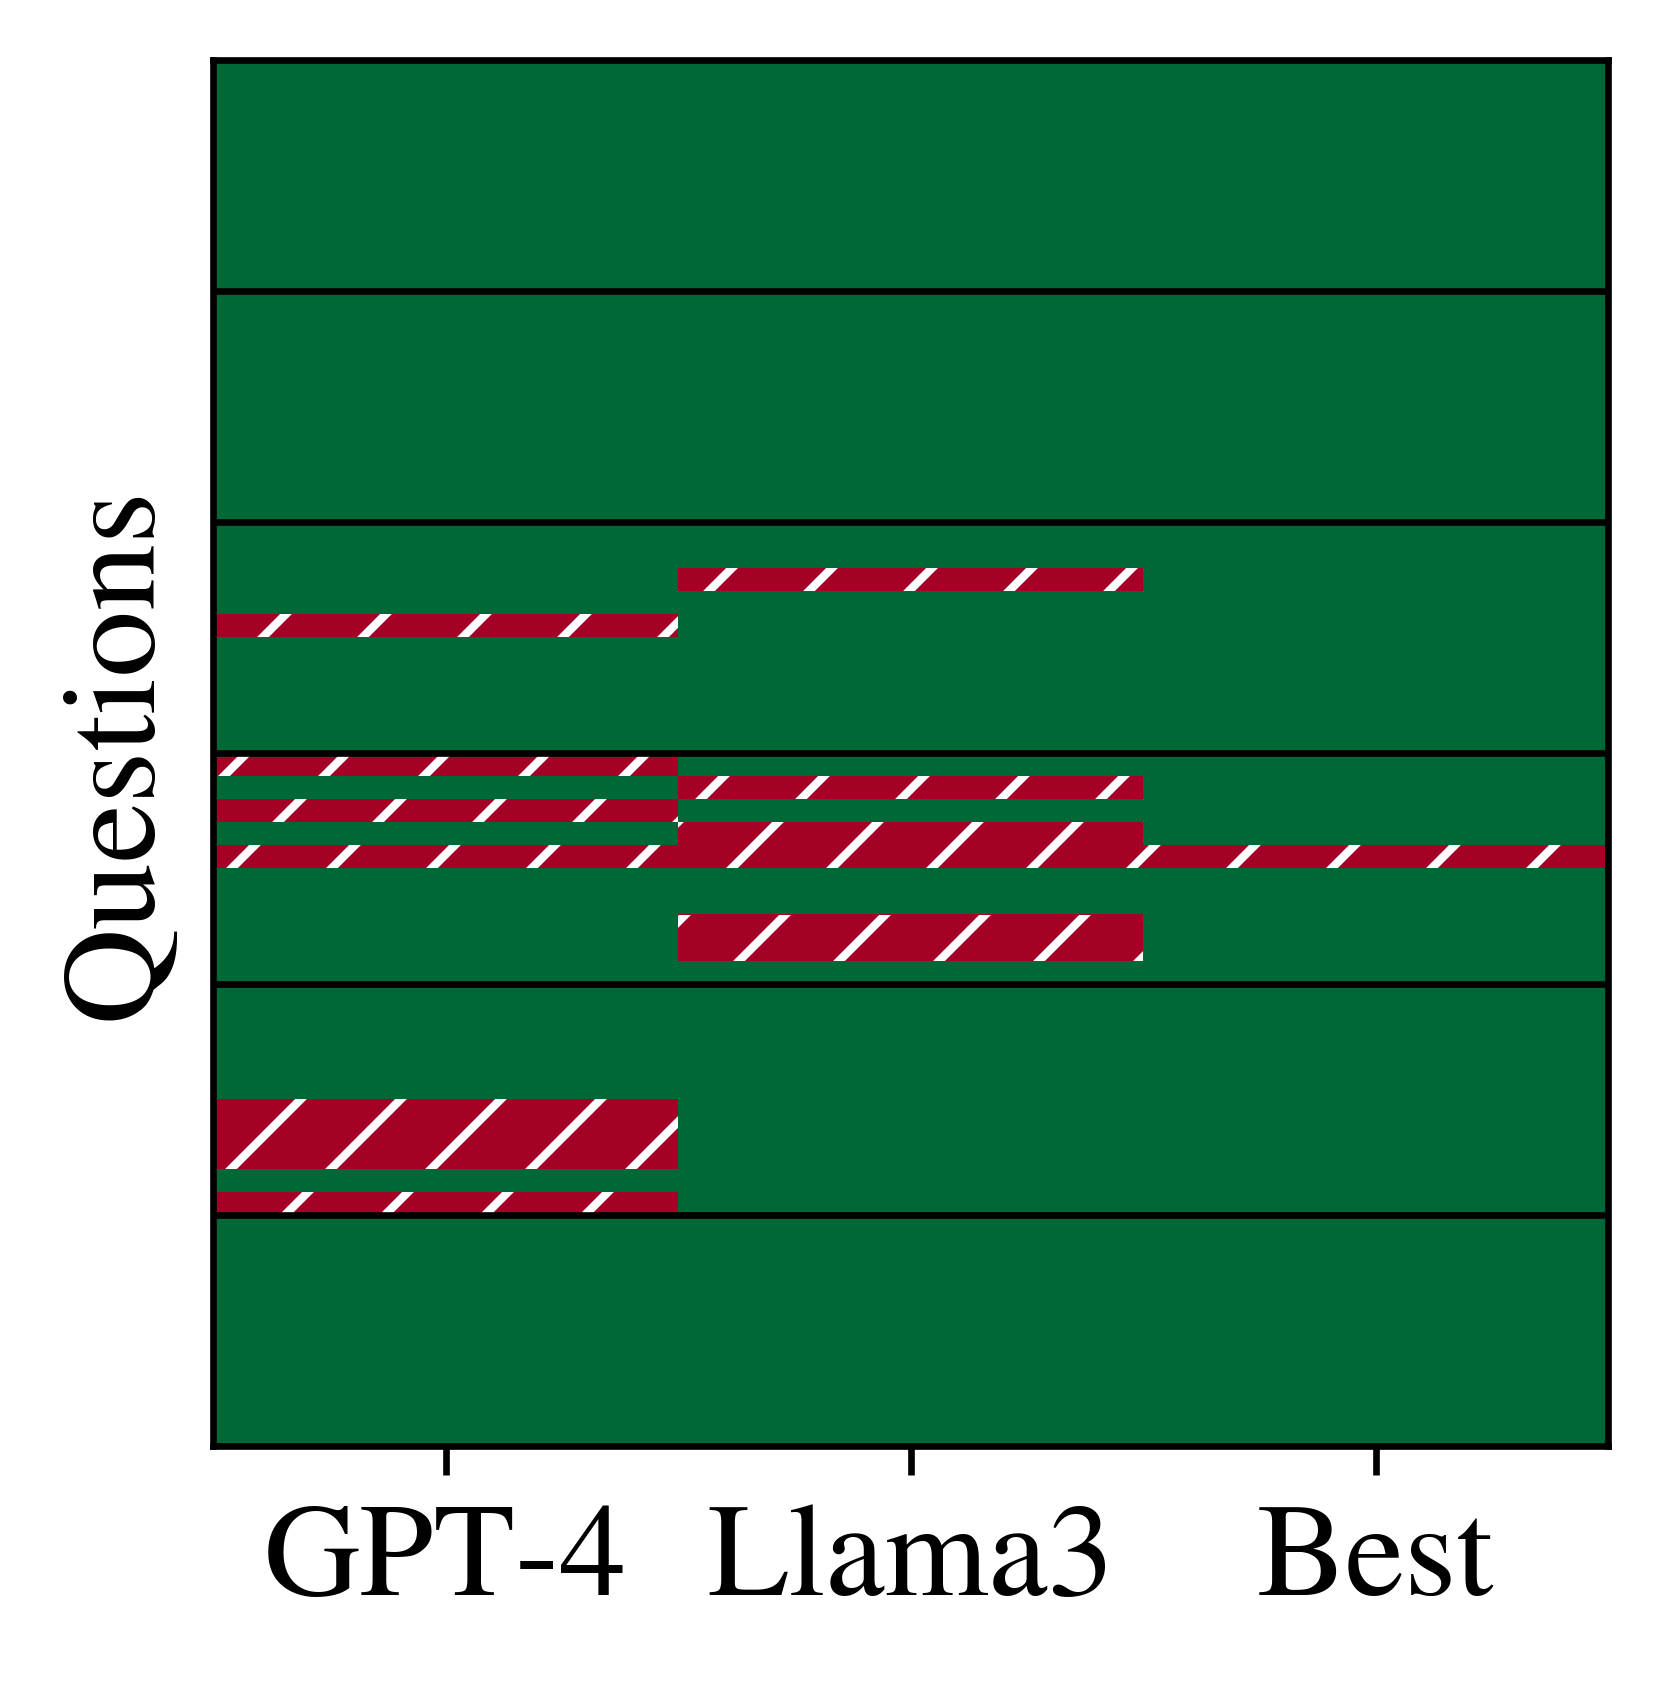
Ensembles of GPT-4 and Llama-3 have high potential as they show little error overlap.
Conclusion
The study shows some patterns in equity research worth pointing out:
- Analysts usually do not create custom diagrams that deep-dive into product specifications, distribution or supply chains, market structures, or other complex relationships that underly the covered firms' business. In fact, only 15% of the statements financial analysts make are hard to automate by LLMs in principle, as these represent strategic outlooks or opinions. Thus, the automation potential of equity research is high, as their "human touch" is already minuscle today.
- Most of the statements in financial report relate to financial information -- which can already be found in financial databases and does not require LLMs to be extracted.
- We still need to caution that analysts perform important roles that LLMs will not be able to replicate. For example, they personally meet management teams and may get subtle clues about the confidence and capabilities of these managers in these meetings.
Outlook
Today’s ERRs heavily focus on financials. This probably arises from the skill set of their authors. Most financial analysts have degrees in business and finance, and these analysts are usually no product or service experts in the industries that they cover. LLMs offer potential for more holistic coverage that takes product and service quality of the covered firms into account, introducing an underappreciated aspect to equity research.
Link to the Paper
References
[1] Brown, T., Mann, B., Ryder, N., Subbiah, M., Kaplan, J., Dhariwal, P., et al. (2020). Language Models Are Few-Shot Learners. Advances in Neural Information Processing Systems (NeurIPS).
[2] Devlin, J., Chang, M.-W., Lee, K., & Toutanova, K. (2019). BERT: Pre-training of Deep Bidirectional Transformers for Language Understanding. Proceedings of the 2019 Conference of the North American Chapter of the Association for Computational Linguistics: Human Language Technologies (NAACL-HLT).
[3] Fawcett, T. (2006). Introduction to Receiver Operator Curves. Pattern Recognition Letters.
[4] Gilbert, E. (2014). VADER: A Parsimonious Rule-Based Model for Sentiment Analysis of Social Media Text. International Conference on Weblogs and Social Media (ICWSM).
[5] Kojima, T., Gu, S. S., Reid, M., Matsuo, Y., & Iwasawa, Y. (2022). Large Language Models Are Zero-Shot Reasoners. Advances in Neural Information Processing Systems (NeurIPS).
[6] Liu, P., Yuan, W., Fu, J., Jiang, Z., Hayashi, H., & Neubig, G. (2023). Pre-Train, Prompt, and Predict: A Systematic Survey of Prompting Methods in Natural Language Processing. ACM Computing Surveys.
[7] Maia, M., Handschuh, S., Freitas, A., Davis, B., McDermott, R., Zarrouk, M., & Balahur, A. (2018). WWW’18 Open Challenge: Financial Opinion Mining and Question Answering. Companion Proceedings of the Web Conference.
[8] Malo, P., Sinha, A., Korhonen, P., Wallenius, J., & Takala, P. (2014). Good Debt or Bad Debt: Detecting Semantic Orientations in Economic Texts. Journal of the Association for Information Science and Technology.
[9] Liu, Z., Huang, D., Huang, K., Li, Z., & Zhao, J. (2021). FinBERT: A Pre-Trained Financial Language Representation Model for Financial Text Mining. International Conference on Artificial Intelligence.
[10] Woodford, M. (2005). Central Bank Communication and Policy Effectiveness. National Bureau of Economic Research, Cambridge, MA, USA.
[11] Hansen, S., McMahon, M., & Tong, M. (2019). The Long-Run Information Effect of Central Bank Communication. Journal of Monetary Economics.
[12] Araci, D. (2019). FinBERT: Financial Sentiment Analysis with Pre-trained Language Models. arXiv.
[13] Peters, M., Neumann, M., Iyyer, M., Gardner, M., Clark, C., Lee, K., & Zettlemoyer, L. (2018). Deep Contextualized Word Representations. Proceedings of the Conference of the North American Chapter of the Association for Computational Linguistics: Human Language Technologies (NAACL-HLT).
[14] Niklaus, C., Freitas, A., & Handschuh, S. (2022). Shallow Discourse Parsing for Open Information Extraction and Text Simplification. Workshop on Computational Approaches to Discourse, International Conference on Computer Linguistics.
[15] Chatterjee, N., & Agarwal, R. (2023). Studying the Effect of Syntactic Simplification on Text Summarization. IETE Technical Review.
[16] Cetto, M., Niklaus, C., Freitas, A., & Handschuh, S. (2018). Graphene: A Context-Preserving Open Information Extraction System. International Conference on Computational Linguistics: System Demonstrations.
[17] Abdel-Nabi, H., Awajan, A., & Ali, M. (2023). Deep Learning-Based Question Answering: A Survey. Knowledge and Information Systems.
[18] Izacard, G., Lewis, P., Lomeli, M., Hosseini, L., Petroni, F., Schick, T., Dwivedi-Yu, J., Joulin, A., Riedel, S., & Grave, E. (2022). Atlas: Few-Shot Learning with Retrieval Augmented Language Models. arXiv.
[19] Guu, K., Lee, K., Tung, Z., Pasupat, P., & Chang, M.-W. (2020). REALM: Retrieval-Augmented Language Model Pre-Training. International Conference on Machine Learning (ICML), Proceedings of Machine Learning Research (PMLR).
[20] Karpukhin, V., Oguz, B., Min, S., Lewis, P., Wu, L., Edunov, S., Chen, D., & Yih, W.-T. (2020). Dense Passage Retrieval for Open-Domain Question Answering. Conference on Empirical Methods in Natural Language Processing (EMNLP).
[21] Lewis, P., Perez, E., Piktus, A., Petroni, F., Karpukhin, V., Goyal, N., Küttler, H., Lewis, M., Yih, W.-T., Rocktäschel, T., Riedel, S., & Kiela, D. (2020). Retrieval-Augmented Generation for Knowledge-Intensive NLP Tasks. Advances in Neural Information Processing Systems.
[22] Touvron, H., Lavril, T., Izacard, G., Martinet, X., Lachaux, M.-A., Lacroix, T., Rozière, B., Goyal, N., Hambro, E., Azhar, F., et al. (2023). LLaMA: Open and Efficient Foundation Language Models. arXiv.
[23] Press, O., Smith, N., & Lewis, M. (2022). Train Short, Test Long: Attention with Linear Biases Enables Input Length Extrapolation. International Conference on Learning Representations (ICLR).
[24] Antony, D., Abhishek, S., Singh, S., Kodagali, S., Darapaneni, N., Rao, M., Paduri, A. R., & Bandalakunta Gururajarao, S. (2023). A Survey of Advanced Methods for Efficient Text Summarization. IEEE Computing and Communication Workshop and Conference (CCWC).
[25] Chen, S., Wong, S., Chen, L., & Tian, Y. (2023). Extending Context Window of Large Language Models via Positional Interpolation. arXiv.
[26] Wu, S., Irsoy, O., Lu, S., Dabravolski, V., Dredze, M., Gehrmann, S., Kambadur, P., Rosenberg, D., & Mann, G. (2023). BloombergGPT: A Large Language Model for Finance. arXiv.
[27] Fama, E., & French, K. (2018). Choosing Factors. Journal of Financial Economics.
[28] Fama, E., & French, K. (2015). A Five-Factor Asset Pricing Model. Journal of Financial Economics.
[29] Fama, E., & French, K. (1995). Size and Book-to-Market Factors in Earnings and Returns. The Journal of Finance.
[30] Fama, E. (1965). The Behavior of Stock-Market Prices. The Journal of Business.
[31] Fama, E., & French, K. (1992). The Cross-Section of Expected Stock Returns. The Journal of Finance.
[32] Carhart, M. (1997). On Persistence in Mutual Fund Performance. The Journal of Finance.
[33] Asness, C., Moskowitz, T., & Pedersen, L. (2013). Value and Momentum Everywhere. The Journal of Finance.
[34] Dyer, T., & Kim, E. (2021). Anonymous Equity Research. Journal of Accounting Research.
[35] Gleason, C., Johnson, B., & Li, H. (2013). Valuation Model Use and the Price Target Performance of Sell-Side Equity Analysts. Contemporary Accounting Research.
[36] Asquith, P., Mikhail, M., & Au, A. (2005). Information Content of Equity Analyst Reports. Journal of Financial Economics.
[37] Imam, S., Chan, J., & Shah, S. (2013). Equity Valuation Models and Target Price Accuracy in Europe: Evidence From Equity Reports. International Review of Financial Analysis.
[38] Arand, D., Kerl, A., & Walter, A. (2015). When Do Sell-Side Analyst Reports Really Matter? Shareholder Protection, Institutional Investors and the Informativeness of Equity Research. European Financial Management.
[39] Bonini, S., Zanetti, L., Bianchini, R., & Salvi, A. (2010). Target Price Accuracy in Equity Research. Journal of Business Finance & Accounting.
[40] Twedt, B., & Rees, L. (2012). Reading Between the Lines: An Empirical Examination of Qualitative Attributes of Financial Analysts’ Reports. Journal of Accounting and Public Policy.
[41] Cheng, W., & Ho, J. (2017). A Corpus Study of Bank Financial Analyst Reports: Semantic Fields and Metaphors. International Journal of Business Communication.
[42] Mikhail, M., Walther, B., & Willis, R. (2004). Do Security Analysts Exhibit Persistent Differences in Stock Picking Ability? Journal of Financial Economics.
[43] Barber, B., Lehavy, R., McNichols, M., & Trueman, B. (2001). Can Investors Profit From the Prophets? Security Analyst Recommendations and Stock Returns. The Journal of Finance.
[44] Bjerring, J., Lakonishok, J., & Vermaelen, T. (1983). Stock Prices and Financial Analysts’ Recommendations. The Journal of Finance.
[45] Elton, E., Gruber, M., & Grossman, S. (1986). Discrete Expectational Data and Portfolio Performance. The Journal of Finance.
[46] Liu, P., Smith, S., & Syed, A. (1990). Stock Price Reactions to the Wall Street Journal’s Securities Recommendations. Journal of Financial and Quantitative Analysis.
[47] Beneish, M. (1991). Stock Prices and the Dissemination of Analysts’ Recommendation. Journal of Business.
[48] Stickel, S. (1995). The Anatomy of the Performance of Buy and Sell Recommendations. Financial Analysts Journal.
[49] Michaely, R., & Womack, K. (1999). Conflict of Interest and the Credibility of Underwriter Analyst Recommendations. The Review of Financial Studies.
[50] Scao, T. L., Fan, A., Akiki, C., Pavlick, E., Ilić, S., Hesslow, D., Castagné, R., Luccioni, A. S., & Yvon, F. (2022). Bloom: A 176b-Parameter Open-Access Multilingual Language Model. arXiv.
[51] Rae, J., Borgeaud, S., Cai, T., Millican, K., Hoffmann, J., et al. (2022). Scaling Language Models: Methods, Analysis & Insights from Training Gopher. arXiv.
[52] Zhang, S., Roller, S., Goyal, N., Artetxe, M., Chen, M., Chen, S., Dewan, C., Diab, M., Li, X., & Lin, X. V. (2022). OPT: Open Pre-Trained Transformer Language Models. arXiv.
[53] Desislavov, R., Martínez-Plumed, F., & Hernández-Orallo, J. (2023). Trends in AI Inference Energy Consumption: Beyond the Performance-vs-Parameter Laws of Deep Learning. Sustainable Computing: Informatics and Systems.
[54] Chen, Z., Chen, W., Smiley, C., Shah, S., Borova, I., Langdon, D., Moussa, R., Beane, M., Huang, T.-H., Routledge, B., & Wang, W. Y. (2021). FinQA: A Dataset of Numerical Reasoning over Financial Data. Conference on Empirical Methods in Natural Language Processing (EMNLP).
[55] Chen, Y., Fu, Q., Yuan, Y., Wen, Z., Fan, G., Liu, D., Zhang, D., Li, Z., & Xiao, Y. (2023). Hallucination Detection: Robustly Discerning Reliable Answers in Large Language Models. Proceedings of the 32nd ACM International Conference on Information and Knowledge Management (CIKM ‘23).
[56] Womack, K. (1996). Do Brokerage Analysts’ Recommendations Have Investment Value? The Journal of Finance.
[57] Bradshaw, M., Brown, L., & Huang, K. (2013). Do Sell-Side Analysts Exhibit Differential Target Price Forecasting Ability? Review of Accounting Studies.
[58] Borgeaud, S., Mensch, A., Hoffmann, J., Cai, T., Rutherford, E., Millican, K., et al. (2021). Improving Language Models by Retrieving From Trillions of Tokens. International Conference on Machine Learning (ICML), Proceedings of Machine Learning Research (PMLR).
[59] Ji, Z., Lee, N., Frieske, R., Yu, T., Su, D., Xu, Y., Ishii, E., Bang, Y. J., Madotto, A., & Fung, P. (2023). Survey of Hallucination in Natural Language Generation. ACM Computing Surveys.
[60] Zhu, F., Lei, W., Huang, Y., Wang, C., Zhang, S., Lv, J., Feng, F., & Chua, T.-S. (2021). TAT-QA: A Question Answering Benchmark on a Hybrid of Tabular and Textual Content in Finance. Annual Meeting of the ACL and International Joint Conference on Natural Language Processing.
[61] Coleman, B., Merkley, K., & Pacelli, J. (2022). Human Versus Machine: A Comparison of Robo-Analyst and Traditional Research Analyst Investment Recommendations. The Accounting Review.
[62] Thai, V. T., Davis, B., O’Riain, S., O’Sullivan, D., & Handschuh, S. (2008). Semantically Enhanced Passage Retrieval for Business Analysis Activity. European Conference on Information Systems (ECIS).
[63] Kim, A., Muhn, M., & Nikolaev, V. (2024). Financial Statement Analysis with Large Language Models. Chicago Booth Research Paper (forthcoming); Fama-Miller Working Paper.
[64] Meta. (2024). The Llama 3 Herd of Models. Technical Report.
[65] OpenAI. (2023). GPT-4 Technical Report. arXiv.


Our Ph.D. candidate Jan Spörer presented the paper.